
Gold Hit $5,000—But Miners Are Priced Like It's Still $2,000
Chart of the Week #88

I’ve been writing a lot about gold miners lately—and for good reason.
Over the past two weeks, I’ve shown you different angles on the same story: gold breaking records while mining stocks lag behind. Silver hitting all-time highs with miners barely keeping pace. The sector trading at valuations we haven’t seen in generations.
It all points to the same conclusion: mining stocks are absurdly cheap right now.
But today’s chart may be the most striking way to visualize just how historically undervalued these stocks have become.
Take a look at this week’s chart showing the NYSE Arca Gold Miners Index (GDM) relative to the gold price—essentially, how mining stocks are valued compared to the metal itself.
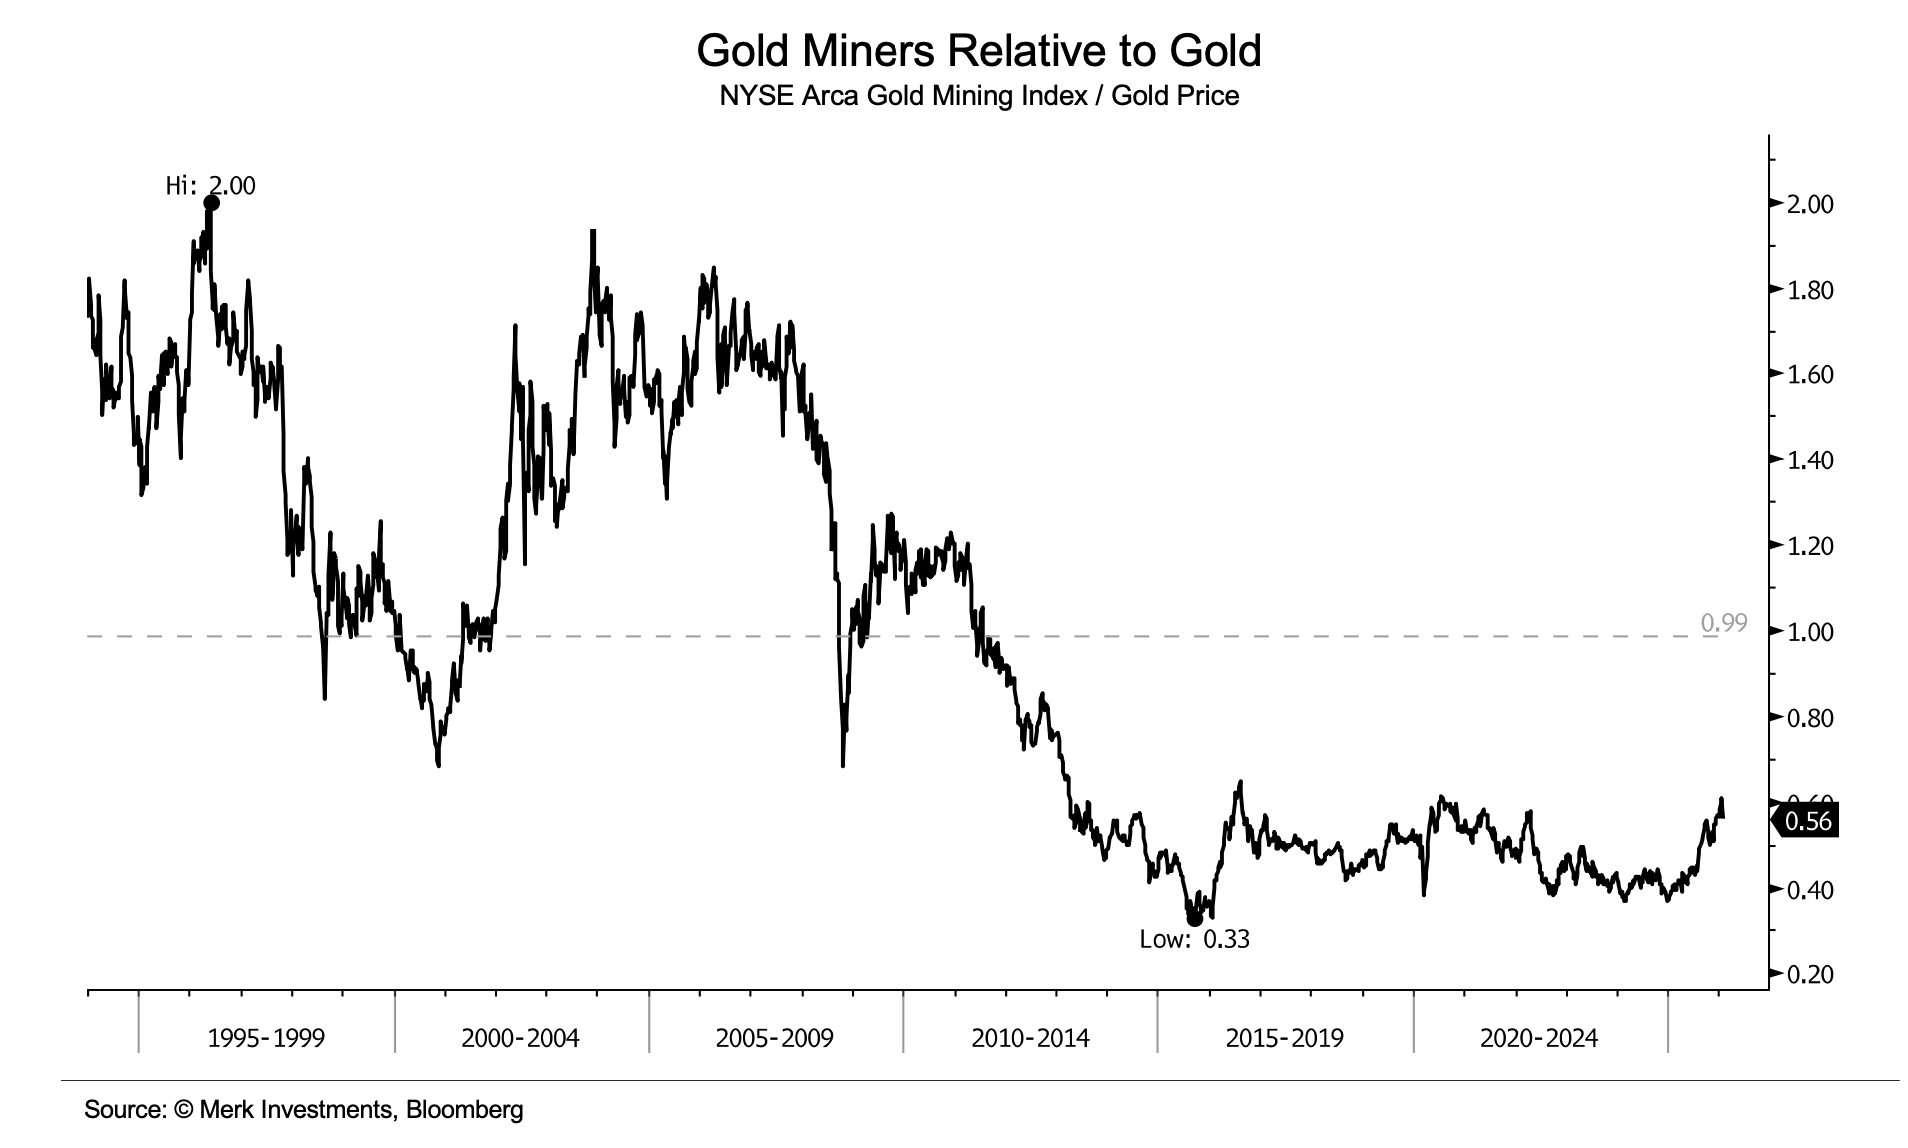
Over the past 30+ years, the ratio of gold mining stocks to gold has swung from a high of 2.00 in the mid-1990s to a low of 0.33 in 2015.
Today, it sits at 0.56—near historic lows.
To put that in perspective, the last time this ratio was around this level—back in 2022—gold was trading around $1,700–$1,800 per ounce. Today, gold is above $5,000—nearly triple that level—yet miners are still valued at almost the same depressed multiples.
Think about what that means.
Central banks continue buying at record levels. Geopolitical tensions are escalating. Gold is trading near all-time highs (and J.P. Morgan just raised its year-end target to $6,300 per ounce). Yet mining stocks—the companies that actually produce the gold everyone wants—are valued as if gold were still stuck below $2,000.
This is what a true disconnect looks like.
Now, if you look more closely at the chart, you’ll notice something important: historically, when this ratio has fallen to extreme lows, it has eventually reverted higher—sometimes violently.
In the early 2000s, the ratio bottomed around 0.65 before exploding to almost 2.00 by 2004—about a threefold surge in miners’ value relative to gold. In the late 2000s, another bottom at a similar level preceded a move to about 1.30.
The pattern is clear: miners lag, miners get hated, and then—when sentiment finally shifts—they catch up with explosive moves. The ratio has stayed compressed for about a decade—well below the 1.00+ levels normal in earlier bull markets. The reversion hasn't happened yet. As strange as it sounds, with gold above $5,000 today, we're still in the "hated" phase.
Doug Casey has been pounding the table on it all through 2025.
He believes we're heading toward a bubble in mining stocks similar to the 1970s—when some miners rose 50-to-1 or even 100-to-1. And this chart shows exactly why that's possible: we're starting from one of the most extreme undervaluations in modern times. Which means, if history is any guide—and if Doug is right—the real fireworks in mining stocks are still ahead.
Regards,
Lau Vegys
P.S. We recently published the latest Crisis Investing issue, covering our 2026 thesis, profit-taking on two uranium holdings that doubled, and raised buy guidance on several of our precious-metals positions. Paid subscribers, make sure you didn’t miss it. If you’re not yet a subscriber, the lead is free and available to all readers.
I always appreciate your wisdom Doug, as well as Matt. Thank you.
Just waiting a bit until metal prices settle down before starting or adding to positions. Very good information.