
Silver and the China Factor
Why Silver's Pullback Doesn't Change the Bullish Case

A few days ago, we published our January Crisis Investing issue with updated guidance on some of our precious metals positions. The issue went out Friday after market close, which means most subscribers couldn’t act on it until Monday morning.
By Monday, gold had dropped from over $5,500 to around $4,700. Silver fell from around $120 to the low $80s.
If you’re a new subscriber who bought Monday morning, congratulations—you got significantly better prices than the ones we quoted in Friday’s issue.
Okay, but what about the pullback?
I’m sure there are those of you wondering whether this is the end of the precious metals bull market. The answer, of course, is no. And while we’ll talk about gold later this week, I wanted to address gold’s more volatile cousin today because my sense is that people are feeling much jumpier about it.
And that’s understandable.
From January 1 to the recent peak, gold surged nearly 30% in less than a month, rising from around $4,330 to over $5,500. Silver’s move was far more extreme: up roughly 66% over the same period, from about $71 to $118. In other words, silver outpaced gold by more than 2-to-1 on the way up.
When anything runs that hard that fast, corrections are not just likely—they're healthy.
Is Silver Too Expensive Relative to Gold?
Fair enough—but what about the idea that silver might be overvalued relative to gold right now?
It’s a fair observation worth addressing. Here’s a look at the gold-to-silver ratio (GSR) over the past year:
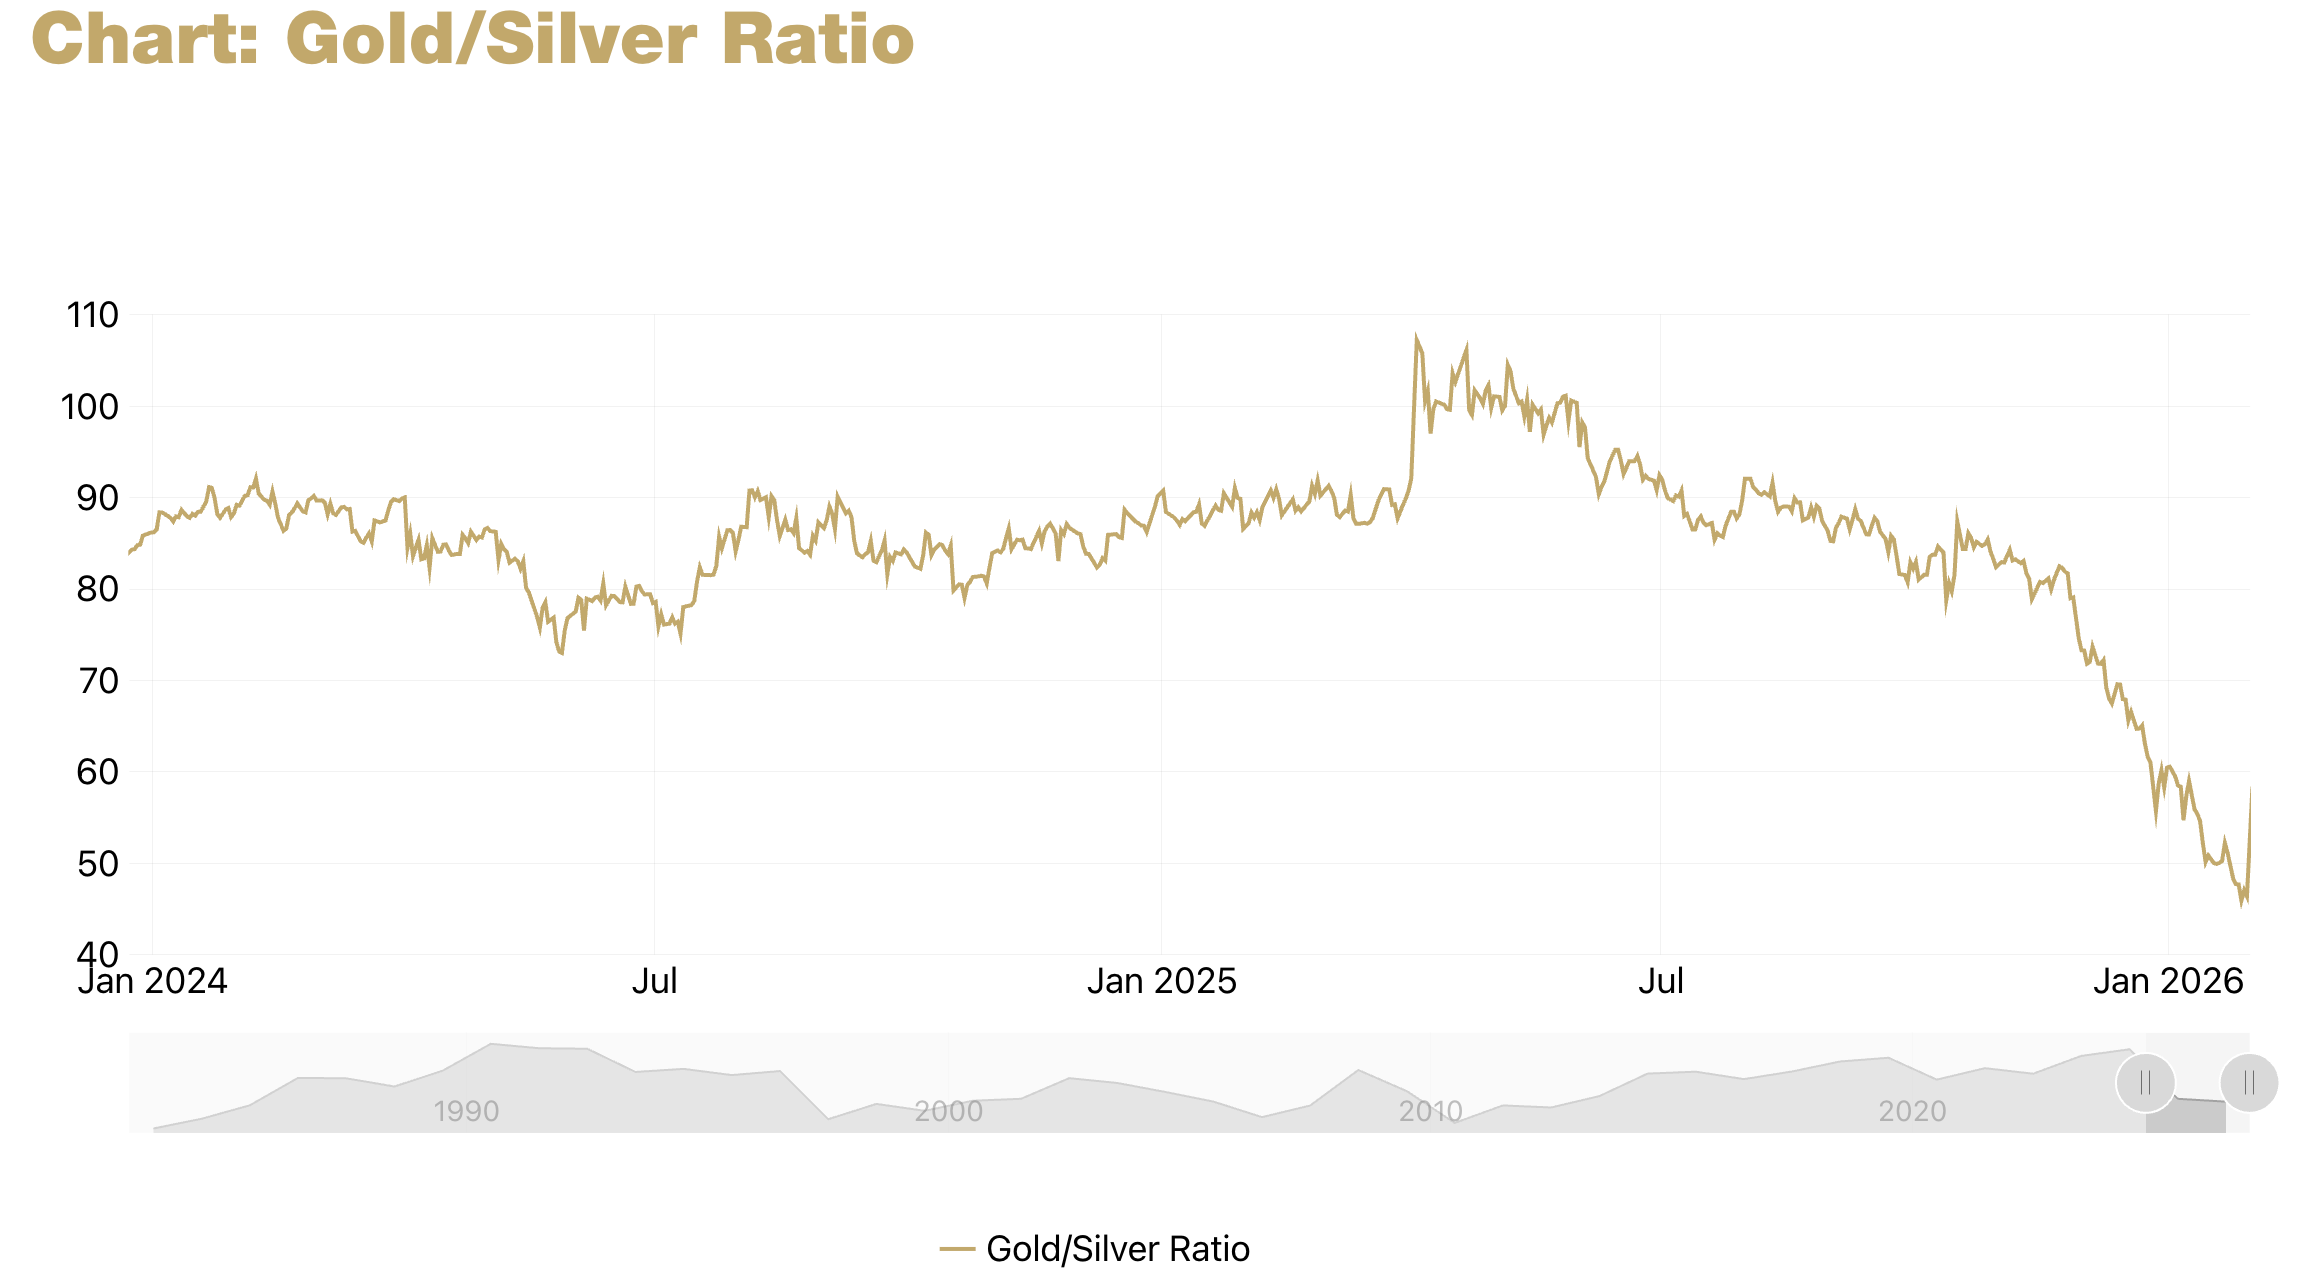
The GSR simply divides the price of gold by the price of silver. Think of it like this: it tells you how many ounces of silver you’d need to trade to get one ounce of gold. If gold is $3,000 and silver is $30, the GSR is 100—meaning you’d need 100 ounces of silver to buy one ounce of gold. When the ratio is high, silver is relatively cheap compared to gold. When it’s low, silver is relatively expensive.
Now, as you can see, the GSR sits around 60. In other words, it takes about 60 ounces of silver to buy one ounce of gold. That’s roughly 10 points higher than at silver’s recent peak, reflecting the pullback (which, again, hit silver much harder than gold).
For context, when we first started recommending silver positions last year, the GSR was well above 80—sometimes over 90. Silver looked historically cheap relative to gold. Today, at a GSR of 60, one could make the case that’s no longer true.
But I advise caution. You should never let a single number or ratio fool you into thinking you’ve found a crystal ball.
For one, historically, the GSR has swung between roughly 12 and 100 over the past century. And during all that time, you would have gotten it right as many times as you would have gotten it wrong if you sold silver whenever it approached the 50 mark.
Note: Interestingly, geologists estimate that silver is roughly 17 times more abundant than gold in the earth’s crust. That roughly coincides with the average ratio observed over the centuries—about 15—which has led many investors to believe the GSR will eventually return to that level. So there’s that too.
With all that in mind, my take is this. I continue to stick to the maxim that the GSR “suggests a lot but proves nothing.” That said, I may use it—but only at true extremes. Roughly speaking, that means buying silver when the ratio is near 100 and selling when it’s closer to 30. The only time the ratio fell close to 30, by the way, was back in 2011 when silver exploded in one of its late-cycle “catch-up” manias—a move that delivered me a nice payday before reversing sharply.
At around 60, the GSR just doesn’t strike me as an extreme level right now. Plus, this cycle has dynamics the historical GSR simply can’t capture.
When Markets Split in Two
In a recent podcast, Doug and Matt discussed something critical: the growing fracture in global silver price discovery.
For instance, did you know that right now, silver is trading roughly $15 more expensive in Shanghai and Mumbai than on the COMEX? Calling that a "small premium" would be the understatement of the year.
Now, if you read some of my essays from last month, you probably know the reason. On January 1st, 2026, China implemented comprehensive export controls on silver, requiring government approval for any silver to leave the country.
This is a big deal because China controls roughly 60–70% of global silver refining capacity—meaning that even if silver is mined in Mexico, Australia, or Peru, it often passes through Chinese infrastructure before becoming usable metal. Beijing now has a say in whether that metal leaves or stays.
As Matt pointed out on the podcast, the result has been unprecedented dislocation across the silver market. Dealers are reporting volumes they’ve “never experienced before”—massive inflows of sellers trying to take profits, but wholesalers are offering 15% below spot because they can’t move the metal fast enough.
If this situation persists, think about what that actually means.
For decades, we assumed commodities traded in one integrated global market. COMEX paper price was, for practical purposes, the world price. Physical markets followed.
But what happens when the assumption that prices equalize globally—the foundation of traditional commodity arbitrage—starts to fail? As the world splits into competing blocs—call them U.S.-aligned West versus China-aligned East, or whatever framework you prefer—silver and other commodities that serve as industrial inputs and stores of value will start to develop separate pricing regimes. Copper, rare earths, uranium, and maybe eventually oil could follow.
Silver just happens to be the perfect early warning because it’s both an industrial metal and a monetary metal.
Okay, but what does this mean for its price?
Well, this could be an essay in its own right—a book even. But the short answer is this: I’m bullish. Here’s how I’m thinking about it.
In a unified global market, price spikes are self-correcting. If silver gets tight in one region, metal flows in from elsewhere. Arbitrage caps prices. COMEX sets the global clearing price.
That mechanism breaks once markets fragment.
If silver becomes scarce in one bloc, the price there can rise without supply from another bloc relieving it. Western paper markets can no longer cap the move by offering synthetic supply that never clears physically.
And here’s the thing: over time, global prices don’t converge to the cheapest market—they converge to the most constrained one.
That's what I think is happening now—regardless of events of extreme market volatility like we just saw. Silver is gradually stopping being priced at the margin of Western financial markets and starting to be priced at the margin of physical availability.
That’s a bullish setup, even if it’s messy getting there. Which is why this year, I'd argue watching the physical market matters more than timing trades off the gold-to-silver ratio.
Regards,
Lau Vegys
P.S. As I pointed out in last week’s Chart of the Week, silver mining stocks have dramatically lagged the metal’s move—in some cases delivering essentially zero leverage despite silver’s historic rally. We’ve observed the same pattern in our Crisis Investing portfolio, where our silver positions have delivered strong absolute returns but fallen well behind silver’s percentage gains. For a sector that typically amplifies the metal’s moves by multiples, this gap is unusual—and an opportunity. If you missed Friday’s issue with our updated guidance on precious metals positions and our full 2026 thesis, you can read it here.
Great article. This is a fun market to watch play out
Excellent piece. Thanks!