
The Stock Market Is Looking Dangerously Bubbly
Chart of the Week #76

We skipped last week’s Chart of the Week due to a slew of other content, so here’s this week’s edition a bit earlier than usual.
This one’s about the stock market.
With the Fed cutting rates and ending its QT charade—essentially preparing to fire up the money printer again—piling into mainstream stocks might seem like the obvious play right now.
It’s not.
For starters, the market has become dangerously lopsided.
The “Magnificent 7”—Microsoft (MSFT), Meta (META), Apple (AAPL), Amazon (AMZN), Nvidia (NVDA), Alphabet (GOOGL), and Tesla (TSLA)—now account for 36% of the S&P 500’s market cap. More than a third of the entire index.
These same seven stocks drove roughly half of the market’s gains last year.
That’s not a healthy market. That’s concentration risk.
And then there’s this chart. Take a look.
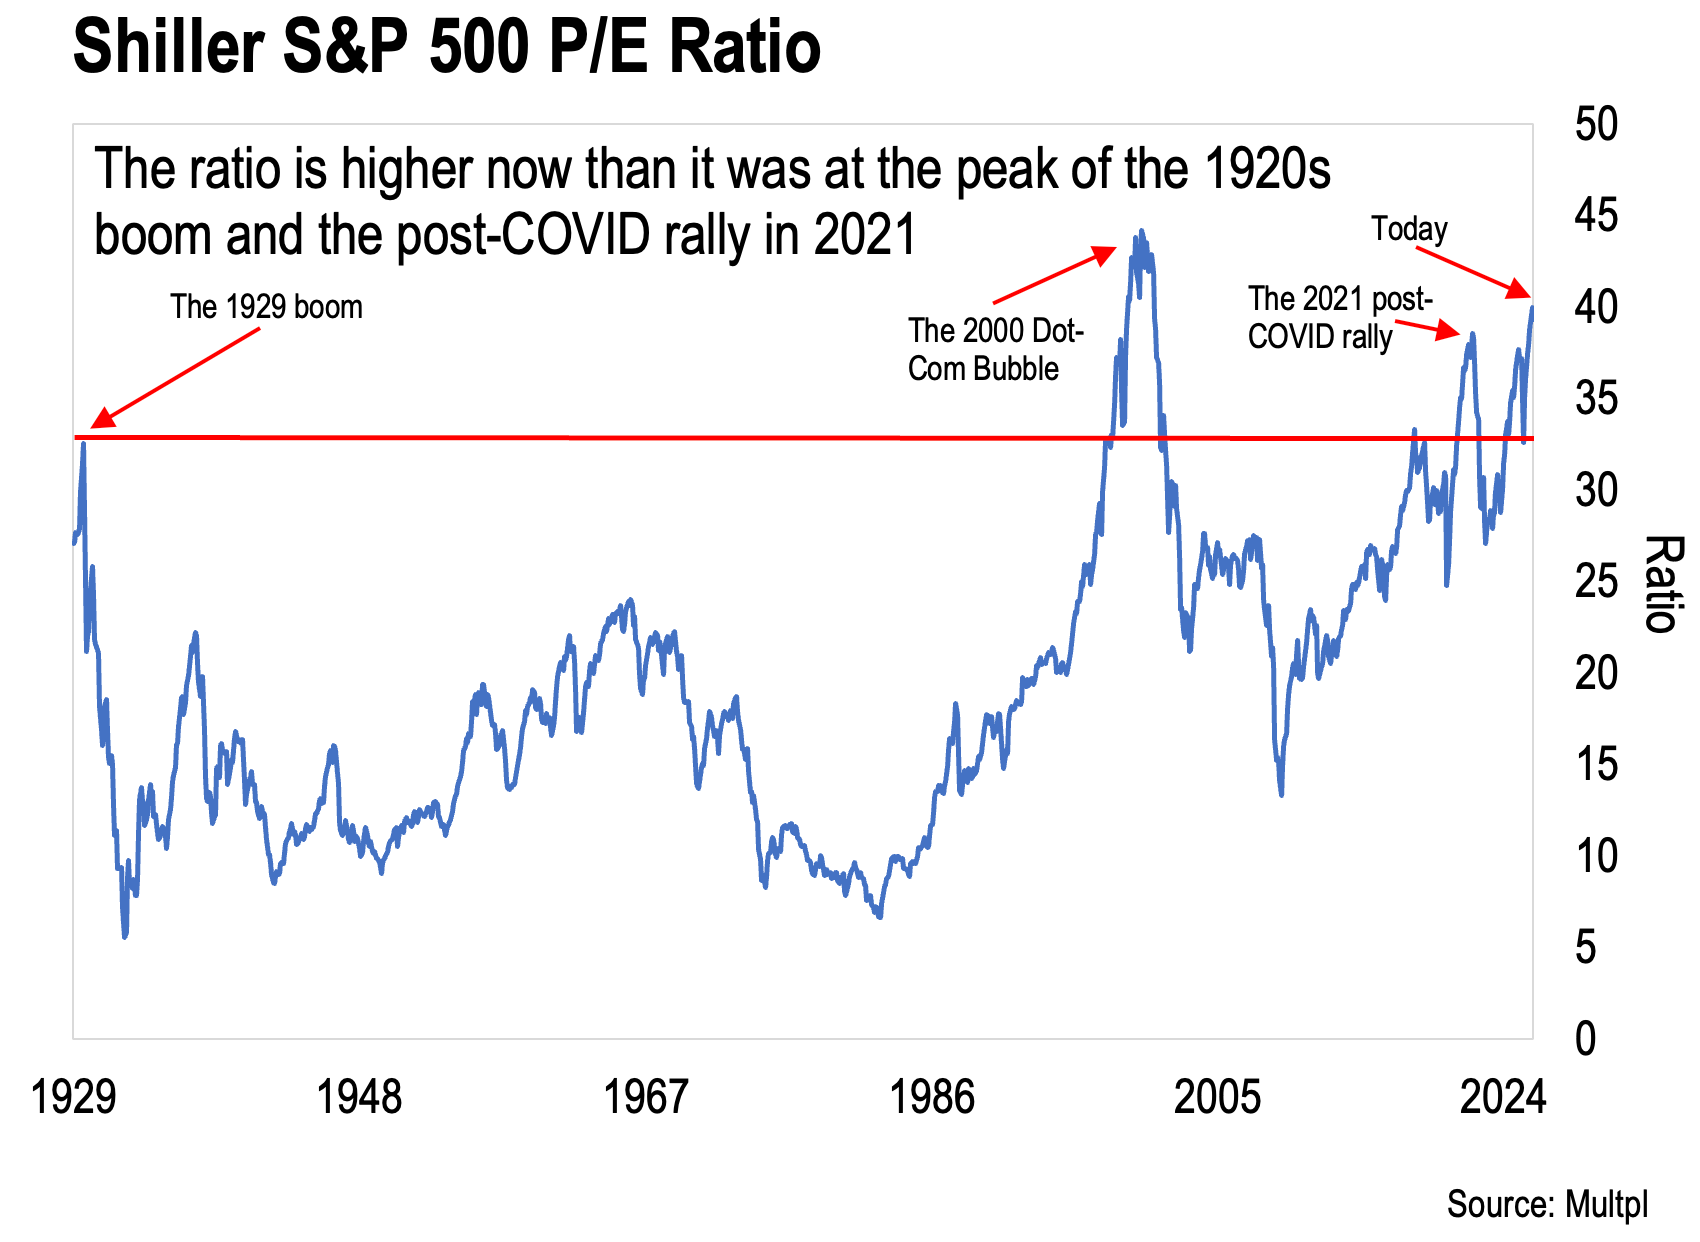
What you’re seeing isn’t the regular price-to-earnings ratio. It’s the Shiller P/E—created by Yale economist Robert Shiller, who won the Nobel Prize in Economics for his work on asset price bubbles.
The Shiller P/E compares current prices to the average inflation-adjusted earnings over the past ten years. It smooths out short-term distortions and gives you a clearer picture of whether stocks are actually cheap or expensive.
Right now, it’s sitting just below 40.
Here’s what that means:
At the 1929 peak—right before the Great Depression—the ratio stood at roughly 32. We’re higher than that now. The only time it’s been higher? The Dot-Com Bubble—which I wrote to you about in the context of AI last week.
Every time the Shiller P/E has crossed into the danger zone marked by the red line above—that Dot-Com Bubble I just mentioned, the 2021 post-COVID mania—it eventually crashed back down. Hard. (The only exception was April 2025, when it bounced off the line instead of breaking through—and kept climbing to where we are now.)
Could the S&P 500 keep rising to Dot-Com levels around 44? Maybe. Stranger things have happened. But is that a risk worth taking? Hardly.
Consider the historical average: 18.7 since 1923.
For the market to revert to that norm—which it always does eventually—one of two things has to happen. Either S&P 500 companies drastically increase their earnings, or stock prices collapse from current levels.
I have to say, the first option feels far less likely than the second. Particularly with everything accelerating in the wrong direction—$38 trillion in federal debt, interest payments exceeding $1 trillion annually, a weakening economy, stubborn inflation, and the Fed still sitting on a bloated balance sheet despite its half-hearted QT efforts.
Bests,
Lau Vegys
Every credit bubble/financial mania ended in financial collapse and this one will too, of course. The difference this time is central banks already pushed short nominal rates to zero hence they cannot foment an even more extreme mania by pushing those rates to new lows again. The multi decade "avoid hangovers, stay drunk" recklessness is over. Now we should be prepared for a fiat currency destroying secular financial collapse.
Tangible assets offer refuge, particularly liquid tangibles (i.e. precious metals), for those who act in a timely fashion. Tragically someone, meaning most everyone, must now hold oceans of bad financial paper all the way down (possibly 90% in real terms); there is no net selling in a market. Many who worked hard and lived responsibly are going to be profoundly harmed through no fault of their own.
Great knowledge straight to the point and wisdom Thank you