
Silver vs. Stocks: Dirt Cheap and Coiled
Chart of the Week #74

I don’t usually start the week with a Chart of the Week. But we just released our latest silver-focused issue of Crisis Investing, and then this silver chart landed on my desk. I figured it was just too timely to wait until later in the week.
Take a look below.
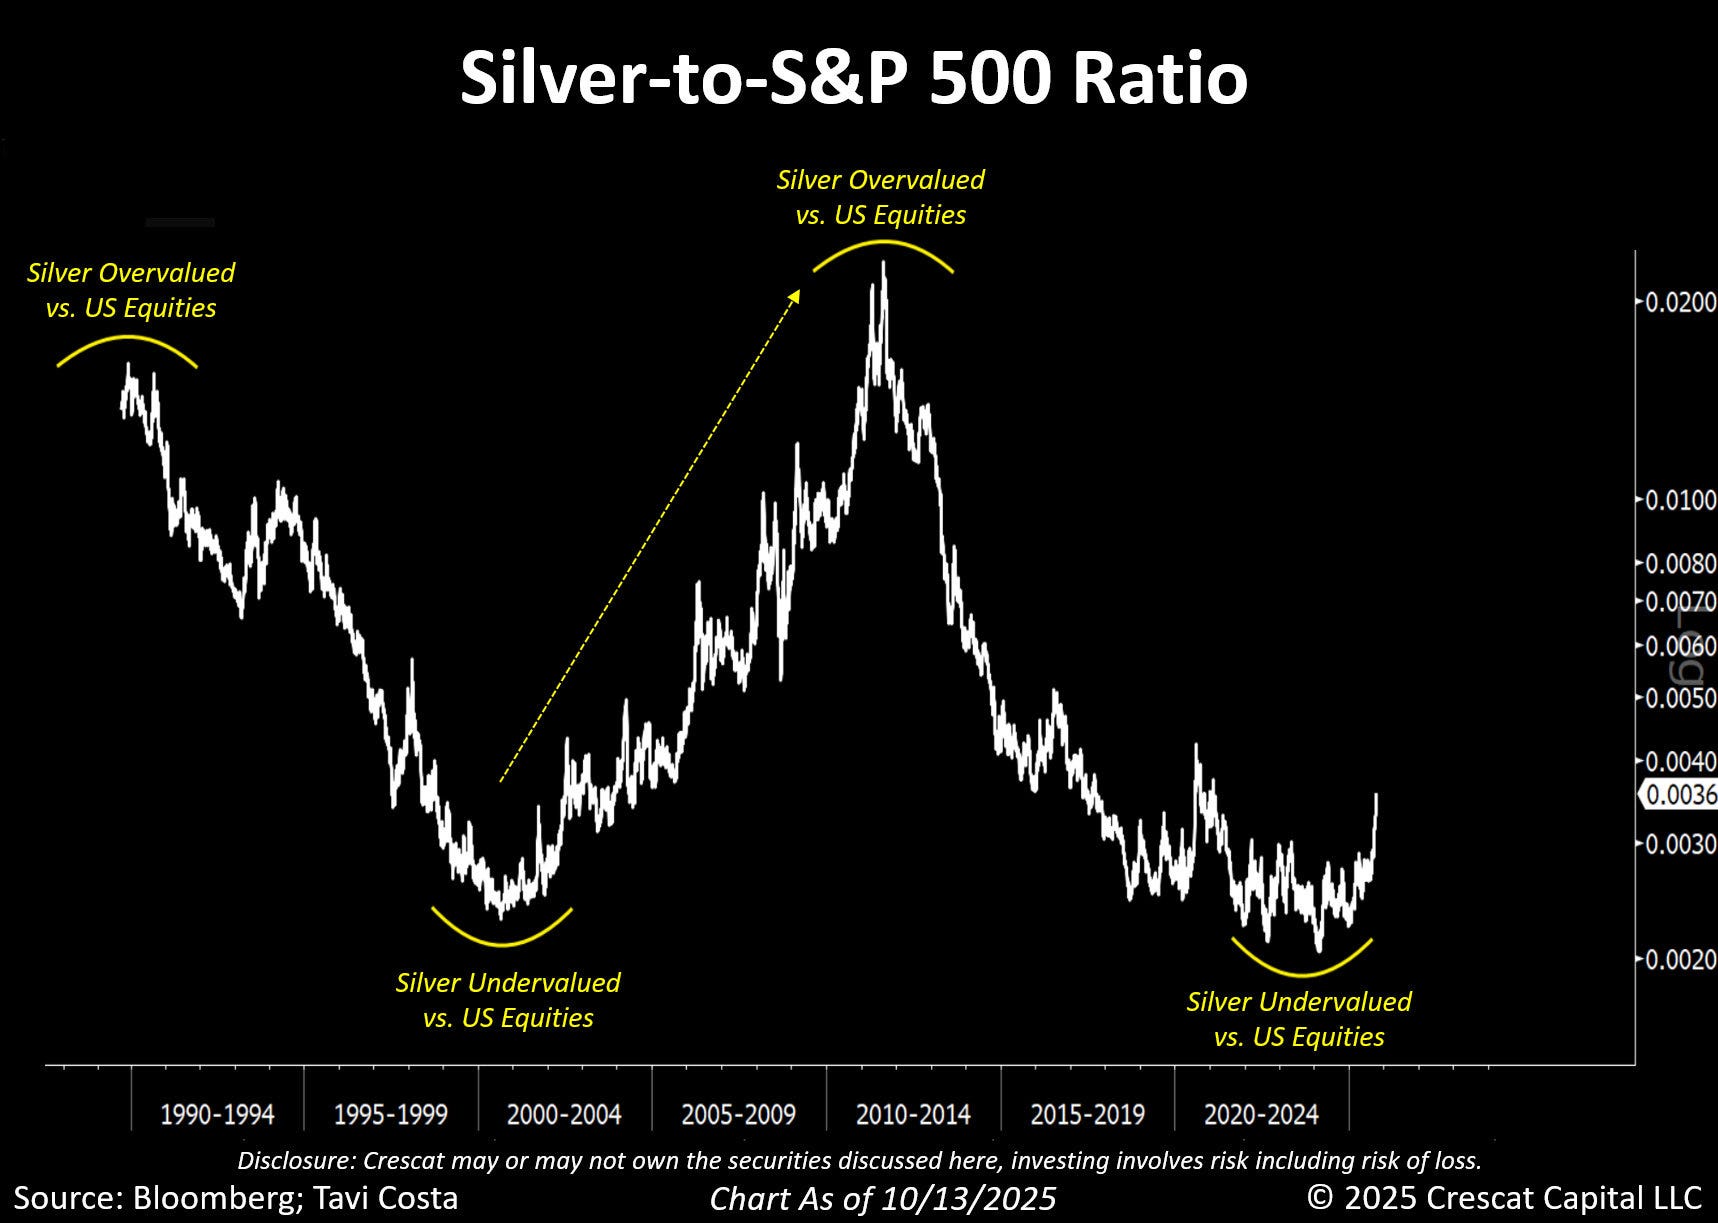
This graph tracks the silver-to-S&P 500 Total Return ratio (SILVER/SPXTR) all the way back to 1990. And what it’s showing right now is quite remarkable: silver is as undervalued relative to U.S. equities as it’s been in more than two decades.
Now, the cutoff date for this chart was mid-October, but as of now the ratio sits at 0.0032—even lower—meaning one ounce of silver buys just 0.0032 points of the S&P 500 Total Return Index (which includes reinvested dividends).
The last time silver got this cheap relative to equities—in the early 2000s—the metal didn’t just outperform. It exploded. Over the following years, silver surged more than 900%, peaking in 2011, while the S&P 500 went mostly sideways.
Now, you might say, “Sure, but that was a unique period—the 2008 global financial crisis, unprecedented uncertainty, all that. Are you suggesting we’re headed there again?”
Not necessarily. But with $38 trillion in national debt, over $1 trillion in annual interest payments, runaway deficits, and the Fed quietly warming up the money printer despite stubborn inflation—well, it doesn’t sound like the U.S. is in great financial shape either.
Plus, look at the chart. Most of silver’s gains over mainstream stocks came before the crisis, not after it.
Fast-forward to today… the setup looks eerily familiar. After peaking in 2011, silver spent the next decade giving back those gains relative to equities. Today, we’re sitting near the bottom of that long cycle.
This base has been forming for nearly five years—much like it did in the early 2000s, right before silver’s historic run.
I’m not saying silver will tenfold from here (though given today’s monetary backdrop, it’s not impossible). What I am saying is that silver looks deeply undervalued relative to the broader market, and history suggests we’re in the early innings of a major rotation into hard assets.
As the old saying goes, history doesn’t repeat—but it rhymes.
Now, you can’t take one chart and treat it as gospel—obviously—but in context, it fits into a much bigger story. We’re entering a phase of currency debasement unlike anything we’ve seen in our lifetimes. And as I mentioned in last week’s Crisis Investing, silver just broke above its 2011 all-time high a little over a month ago—while gold did that back in 2020—five years ago. That alone tells you where the real momentum is building.
Yes, silver is up by double digits this year. True. But that’s nothing compared to what happened the last time this ratio was this compressed.
So the real question isn’t whether to own silver exposure—it’s how to own it.
Physical metal is great for wealth preservation (though silver is bulky, so you’ll likely end up owning “paper silver”). But it doesn’t offer leverage. Silver miners, on the other hand, can deliver outsized returns when the metal moves. Their fixed costs stay the same, while revenues soar—sending profit margins through the roof.
That’s exactly why we’ve added a new silver pick to the Crisis Investing portfolio. As I mentioned in the issue, even after silver’s strong run, silver miners remain cheap. The Global X Silver Miners ETF (SIL) is up over 70% in the past year, yet still sits about 30% below its 2011 peak—a disconnect that rarely lasts once the metal really gets moving.
Regards,
Lau Vegys
What currently mystifies this ol' man is the focus on the past that is so unlike what is unfolding now. The world is rapidly changing and the US$ and the U.S. hegemony is rapidly losing its power. The East (China, Russia, BRICS, ASEAN, and Global South) are rising and the world is going multi-polar plus silver's launch into being maybe the most valuable industrial metal. So, it seems what has happened in the past is essentially a "who cares?" LBMA/Comex are losing their significance and the Shanghai Exchange is growing in power and influence. Just seems so short sighted to this ol' man.
You captured the cyclical nature of silver’s undervaluation with both conviction and historical context. I appreciate how you drew parallels to the early 2000s because it reminded me that investor psychology often resets just before large rotations begin. Recent Bloomberg data shows silver ETF inflows have climbed for three consecutive months, hinting that sentiment may be quietly shifting. There’s something quietly powerful about how you framed this moment—as less about prediction and more about preparation for what history tends to repeat in rhyme.