

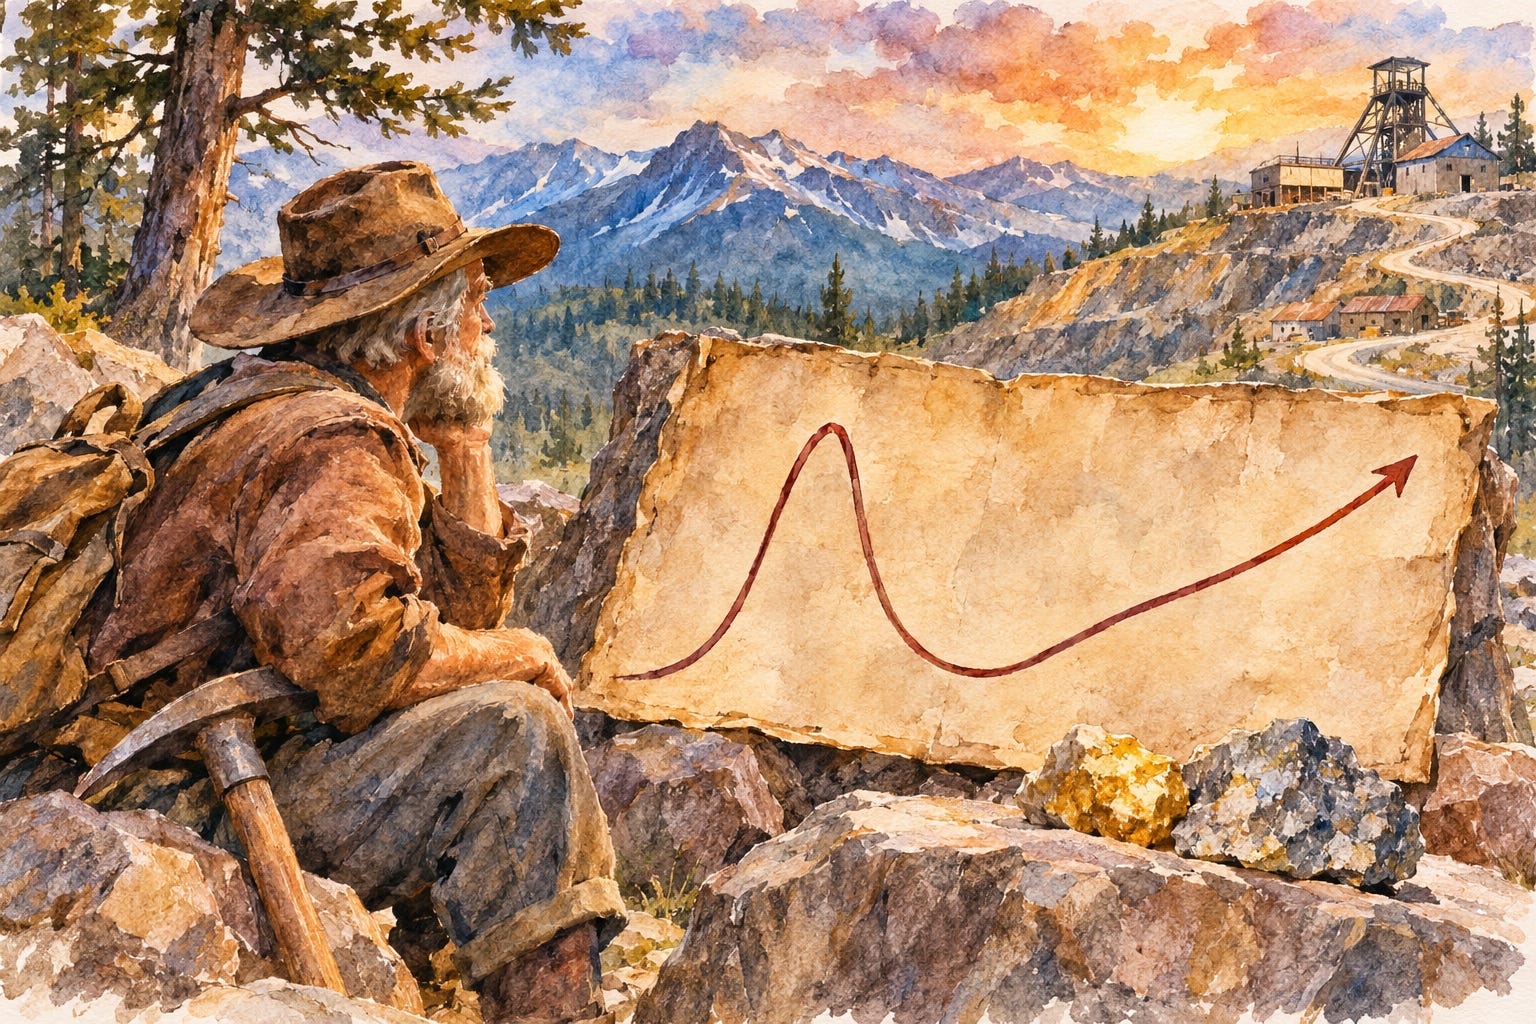
Junior miners start with a claim, a geologist, hope, some spare change, and then a press release. A speculator’s job is to provide the spare change to the companies with good prospects, and at the right time.
What is the right time for us?
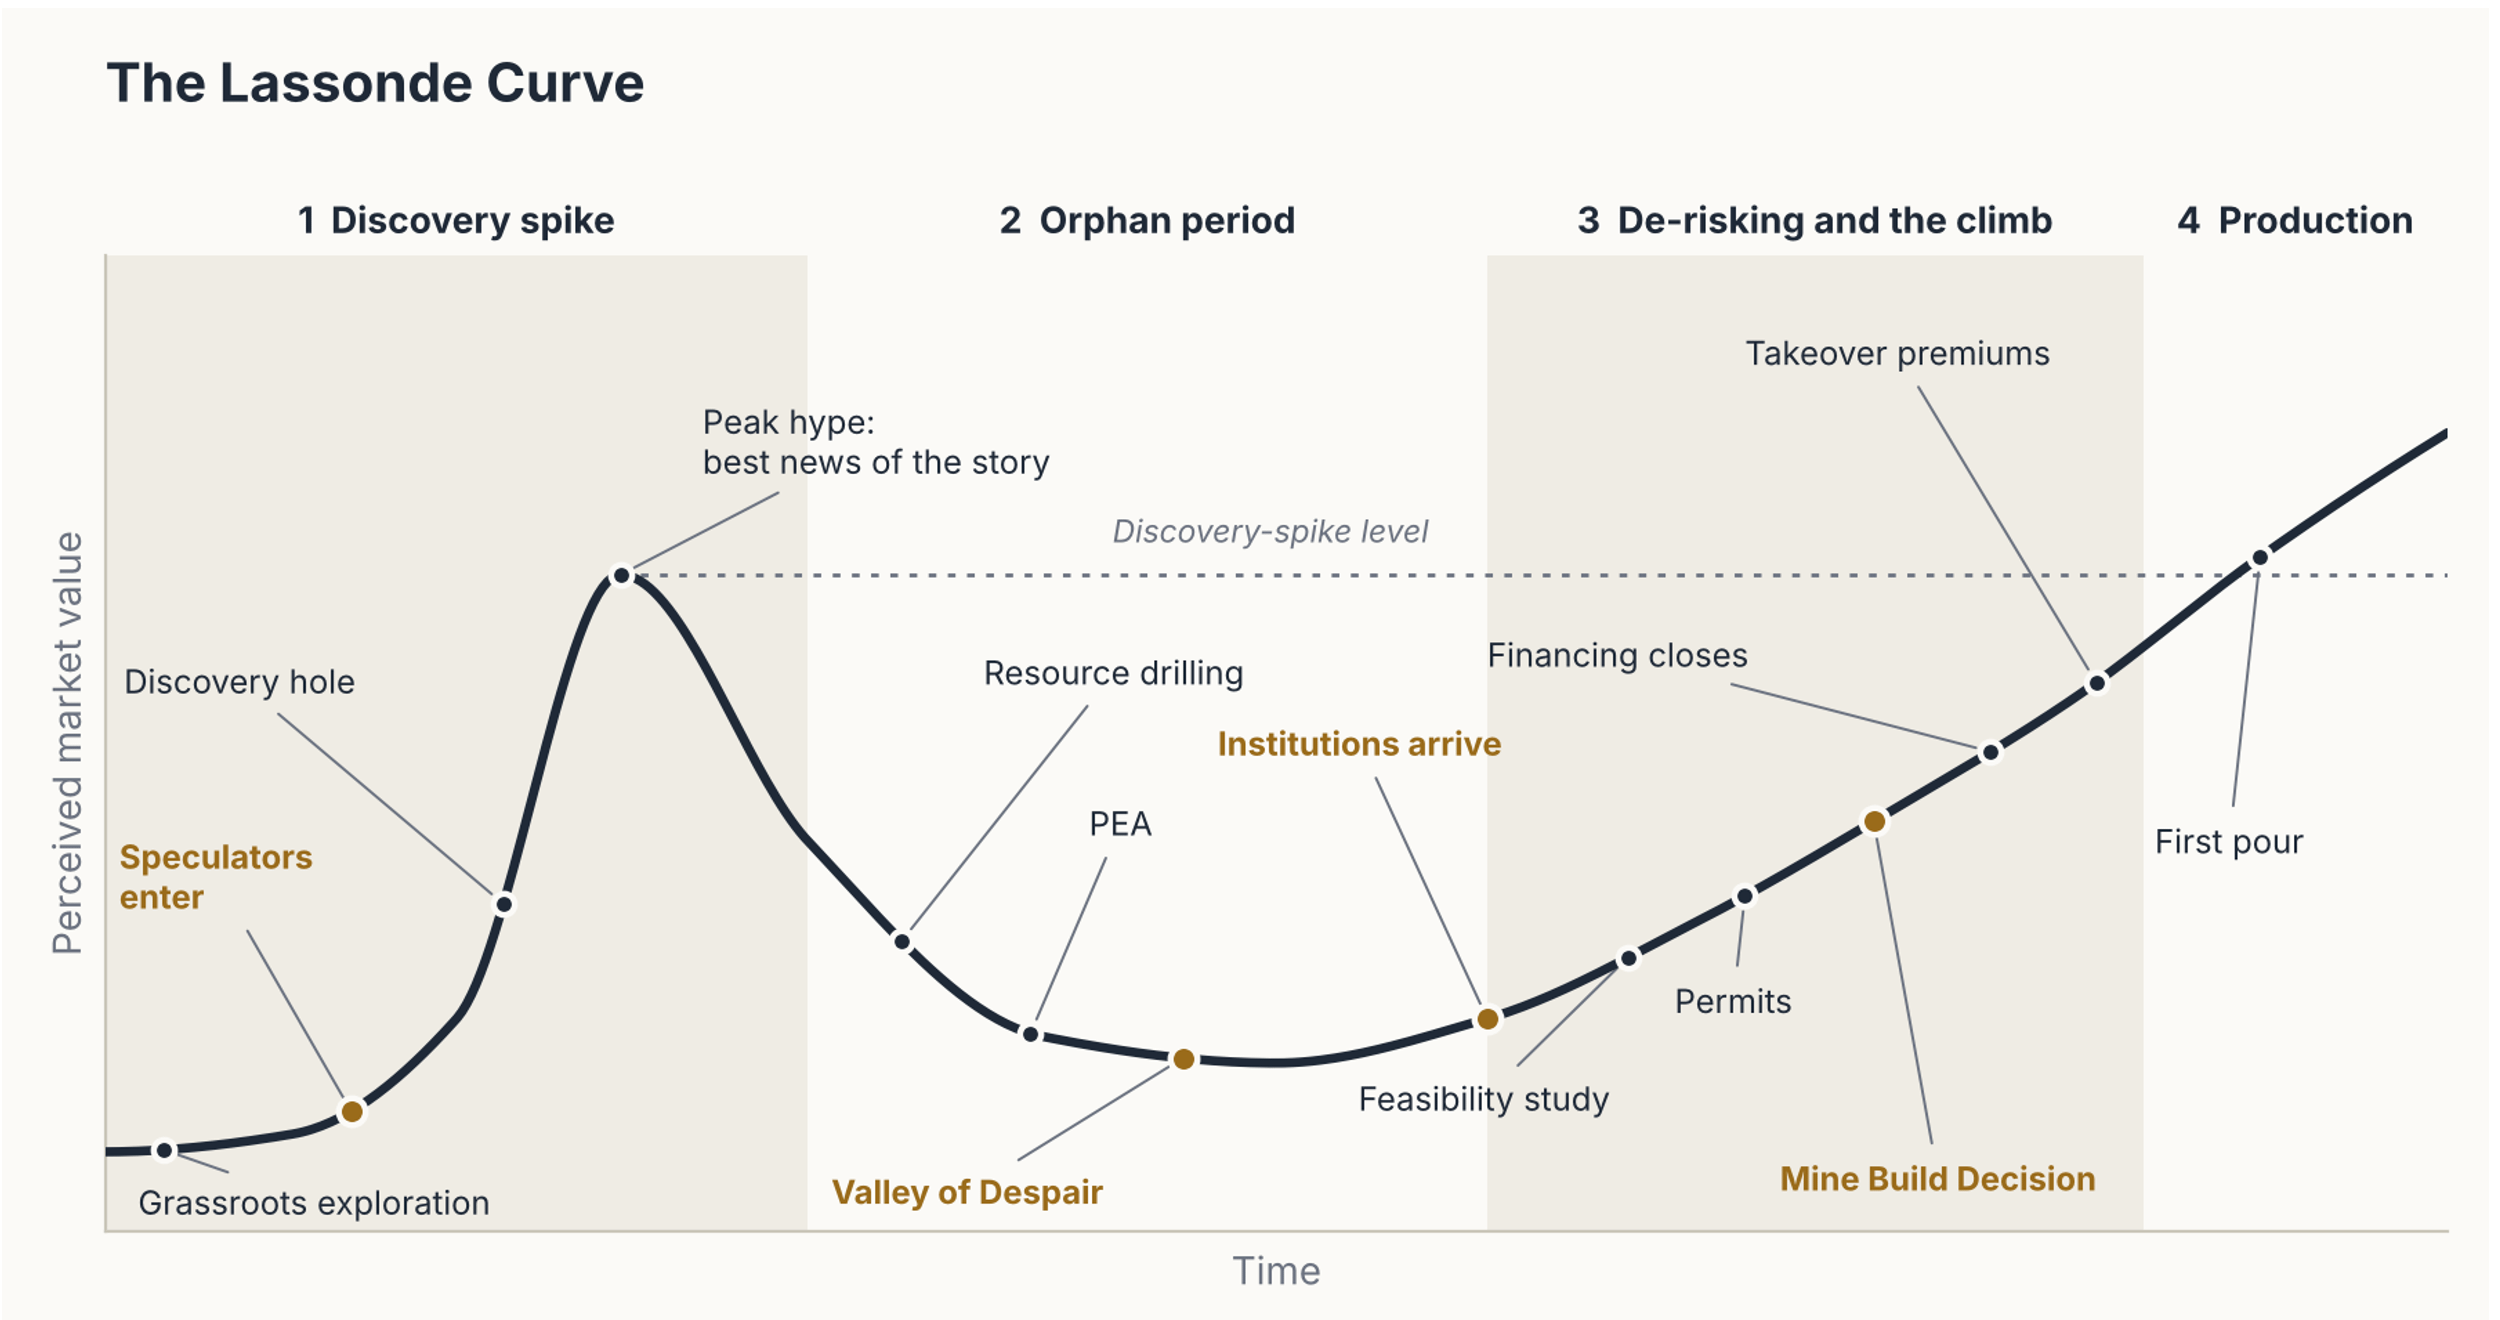
Pierre Lassonde co-founded Franco-Nevada and later served as president of Newmont Mining. During decades of financing and owning mining companies, he’d noticed that junior miners’ perceived market values follow a repeatable arc. That arc is now called the Lassonde Curve.
Learn the curve and you will know when to be excited and when to be bored.
The Lassonde Curve applies most directly to junior miners that have one primary target. Here’s an idealized version of it, with approximate locations of the various standard milestones.
Stage One: The Discovery Spike
A company raises a little money, picks some pretty rocks from the ground (grab samples) and maybe drills a couple of holes. A few ridiculously high grab sample assay results, or a high-grade intercept on a drill core, provide the meat for a press release, and the stock doubles.
At this point the company owns an interesting piece of land. It does not own a mine. Nobody knows how big the deposit is, whether the metal can be recovered at a profit, or whether a government will grant a permit. Speculators arrive first, retail traders follow, and the price rises on hope.
Here’s the key: the peak often comes on the best news the company will release for years. Buyers at the top are paying as if the mine already exists. Pure hope. But there is no mine and won’t be for a long time. After discovery, the average mine takes about 15 to 18 years before it produces. If it ever produces. Most discoveries never become producing mines.
Stage Two: The Orphan Period
After the early speculative peak, the work turns dull. More drilling, mapping the structure, running metallurgical tests, filing for permits, and commissioning studies. There are occasional press releases that few read.
The speculators sold near that earlier peak and went off to seek the next discovery. The institutions have not arrived, because they need risk they can model, and this project is still an unpredictable gamble. The stock has few owners. The price slides, often to a fraction of its peak.
Dilution contributes to this slide. A company with no revenue pays for its geologists and drill rigs and lawyers and consultants by selling shares. When the price is low, it must sell more shares to raise the same dollars. The existing holder watches his slice shrink twice: once from the falling price and again from the growing share count.
Dilution is not inherently bad if the money raised creates more value than the dilution costs. But that value increase is often not recognized during this stretch of time.
This stretch is the orphan period. The Valley of Despair is the bottom. The press releases keep coming. The buyers do not.
During the orphan period the asset gets better while the stock gets worse. The geologists are turning a discovery into a deposit, and the market is paying nothing for the progress. Patience gets tested and patience loses—which is why the stock price falls. Other people’s impatience is the second opportunity for a speculator to come in. But beware, because that orphan period can last years.
Stage Three: De-Risking and the Climb
A positive feasibility study is the point at which the valuation of the company might rise faster than the dilution of the shareholders. It provides a clearer picture of the capital required to build a mine, operating costs, and potential returns. Permits arrive. Each box checked removes some risk, and funds with compliance departments get the numbers they need to fill in boxes on a spreadsheet. A company that cannot finance construction, or sell itself to a company that can, will stall at this stage for years or go under altogether. So the balance sheet should get as much attention as the geology.
The climb (if it occurs) is steady and mostly unglamorous. Financing closes, construction begins, and the price climbs in a slow staircase. Takeover interest picks up along the way. The major miners burn through reserves every year, and they would rather buy a de-risked deposit than find one. Acquisition premiums tend to land in this stretch.
Stage Four: Production
First pour and finally some cash flow. Analysts publish models, and generalist funds buy. The market begins valuing the company on demonstrated production, operating costs, and cash flow rather than speculation about what might be underground. The dull stretch is over. Investors finally see a return.
For the few projects that get this far, the company’s market cap can climb above the discovery spike. A working mine with cash flow is worth more than the market’s best guess at a discovery. The early multiples are gone by now. The biggest gains go to those who bought in the valley and held through and beyond the build decision.
Why the Curve Exists
The curve is a chart of the company’s perceived market value. At the initial speculative spike nothing is known, and the stock price is based on buyers’ imaginations. In the valley, the risks are being resolved one at a time, but the buyers who demand proof don’t yet have enough. The market begins requiring evidence of economic viability and financing in addition to geological proof. Each study and permit converts a guess into a fact, and the price moves when enough people believe that there is profit, not just gold, in them thar hills.
Perceived market value is what the market believes the whole company is worth. In numbers, that is the share price multiplied by the number of shares outstanding. Value is subjective, and the crowd’s perception of a junior swings between hope and despair as the facts arrive. We draw the curve this way. It is often drawn as share price, and the two can diverge.
As I mentioned, during the valley, a company with no revenue keeps selling new shares to pay for drilling and studies. By production, the share count can be several times what it was at the spike. The company’s total value can then end above the spike while the price per share ends below it. A rising curve does not promise a rising stock price. Before you buy, check the share count, the warrants and options outstanding, and how the company plans to pay for the mine.
Using the Curve
First, know which stage you are buying. A stock at the discovery spike needs quick action, but only a small position, because most drill programs never turn into a mine. Take a Casey Free Ride if the stock doubles, or, better yet, bail out entirely and take your profit on the spike. If you came in with a private placement, you hopefully have warrants. If so, you still have a fork in the steak without tying up cash.
If the stock is in the orphan period, the Valley of Despair, you can likely be patient.
Second, a low price does not make a stock good. Doug Casey‘’s 9Ps analysis exists to differentiate a potential mine from a likely zombie: the people running the company, the politics of the jurisdiction, the quality of the property, and the rest of the checklist.
Third, don‘’t confuse the curve with a clock. The curve is idealized. It tells you where a company might be in its lifecycle, not when. The Valley of Despair can last years, and a stock can fall much further before the market recognizes the progress being made.
Real stocks wander off the curve for dozens of reasons, and many never leave the first stage. The line in the picture is smoothed. The stock market is a jagged mess.
Where we like to enter
We speculate in carefully selected drill plays as early as possible, watch them closely, and usually sell during the speculative peak. Buy lowish and don’t forget to sell highish. Warrants keep us in the game, at no extra cost, which is why we like private placements.
We then watch the stock decline and go through the Valley of Despair, then we perhaps come back in as the curve starts to rise, before an impending mine build decision.
The Lassonde Curve is a guideline, not a rule. Some companies never get past the discovery spike. Others spend years in the Valley of Despair, and many never climb out. But understanding the cycle helps us recognize when the market is pricing hope, when it is pricing despair, and when it is finally pricing a mine. Our job is to know the difference—and to have the patience to act when the opportunity presents itself.
Paid subscribers get our monthly stock recommendations and the full portfolio, with positions analyzed based on their 9Ps. Upgrade and see the work behind the picks.
Sincerely,
John Hunt, MD
Editor, Doug Casey’s Crisis Investing
Great article!
I'm very interested in the Lassonde Curve (LC), being fairly new at this (since Feb 2026), I feel getting this right and truly understanding it is of the utmost of importance.
I hope I am asking the right question. -
I sometimes see a company has several sites, that are at different stages of the LC, how do you determine when to buy and how this may or may not effect the stock price.
I'm not interested in getting that involved in this particular investment exercise but I do enjoy hearing about how Crisis Investing measures the steps and makes the plays.