
Market Exuberance Is Back!
The neat, round number of 5,000, swinging from the chandeliers, Magnificent 7, and looming crashes

"A bull market is like sex. It feels best just before it ends."
~ Barton Biggs
I’d forgive you for not noticing.
But the S&P 500 recently peaked above 5,000, just days ago.
This is the highest it has ever reached in the stock market's history.
Well, not exactly... it actually inched higher over the following days, only to give back all those gains shortly after. It's hovering just below 5,000 as I write this.
Now, if there's one thing I know about markets, it's that they are driven by extreme emotions. People can shift from irrational exuberance, where it seems everyone is swinging from the chandeliers, to a bottom-of-the-barrel bear market where they become nauseated just by glancing at the financial news.
It appears we're currently experiencing the former phase.
But if I don my critical hat, there are a couple of interesting things happening in the market.
Take "The Magnificent 7," for instance – those seven tech stocks that typically lead the market and generate significant profits. Right now, just four of them: Amazon (MSFT), Meta (META), Microsoft (MSFT), and Nvidia (NVDA) are responsible for nearly 70% of the stock market's growth this year.
That's crazy. It's like having a large orchestra with hundreds of musicians, yet only four of them are playing 70% of the notes.
Also, one of those stocks, Nvidia (NVDA), recently reached a market cap equals that of the entire Chinese stock market. That’s $1.7 trillion.
None of that sounds very sustainable to me…
Here’s Doug Casey with some words of wisdom:
The public and the fat cats – and absolutely the politicians – all think that a high stock market is, almost by definition, a good thing. But a high stock market doesn’t necessarily mean an economy is doing well, or that public companies are doing well – it just means there’s a perception that this is the case. Or worse, in some cases – like now, I suspect – it means nothing at all, other than that people are afraid to hold currency, government bonds, real estate, or other assets and so-called assets. An artificially high stock market can send dangerous, false signals to businessmen and investors. It can cause false confidence – the kind Wile E. Coyote still has when he runs off a cliff.
Doug is, of course, spot on with his Wile E. Coyote reference here. Markets typically don't crash immediately after hitting an all-time high.
What you usually get is a cluster of more all-time highs back-to-back. For instance, the S&P 500 has set twelve new weekly all-time highs just this year.
And the reason, of course, is human psychology. When the stock market goes up, people tend to think it will keep going up, so they put more money into it.
Young people often refer to this phenomenon as FOMO, or the fear of missing out. It's the intense anxiety that others are enjoying exciting experiences while you're not. This fear extends to different areas of life, such as relationships, social events, and yes, stock market investing.
FOMO has a significant impact on the behavior of teenagers and adolescents. And, evidently, investors are not immune to its effects either.
But since every action has a reaction, the FOMO behavior tends to come with a bad case of hangover. Just take a look at the chart below (I switched it to a logarithmic scale so you can easily see the pullbacks over the longer timeline).
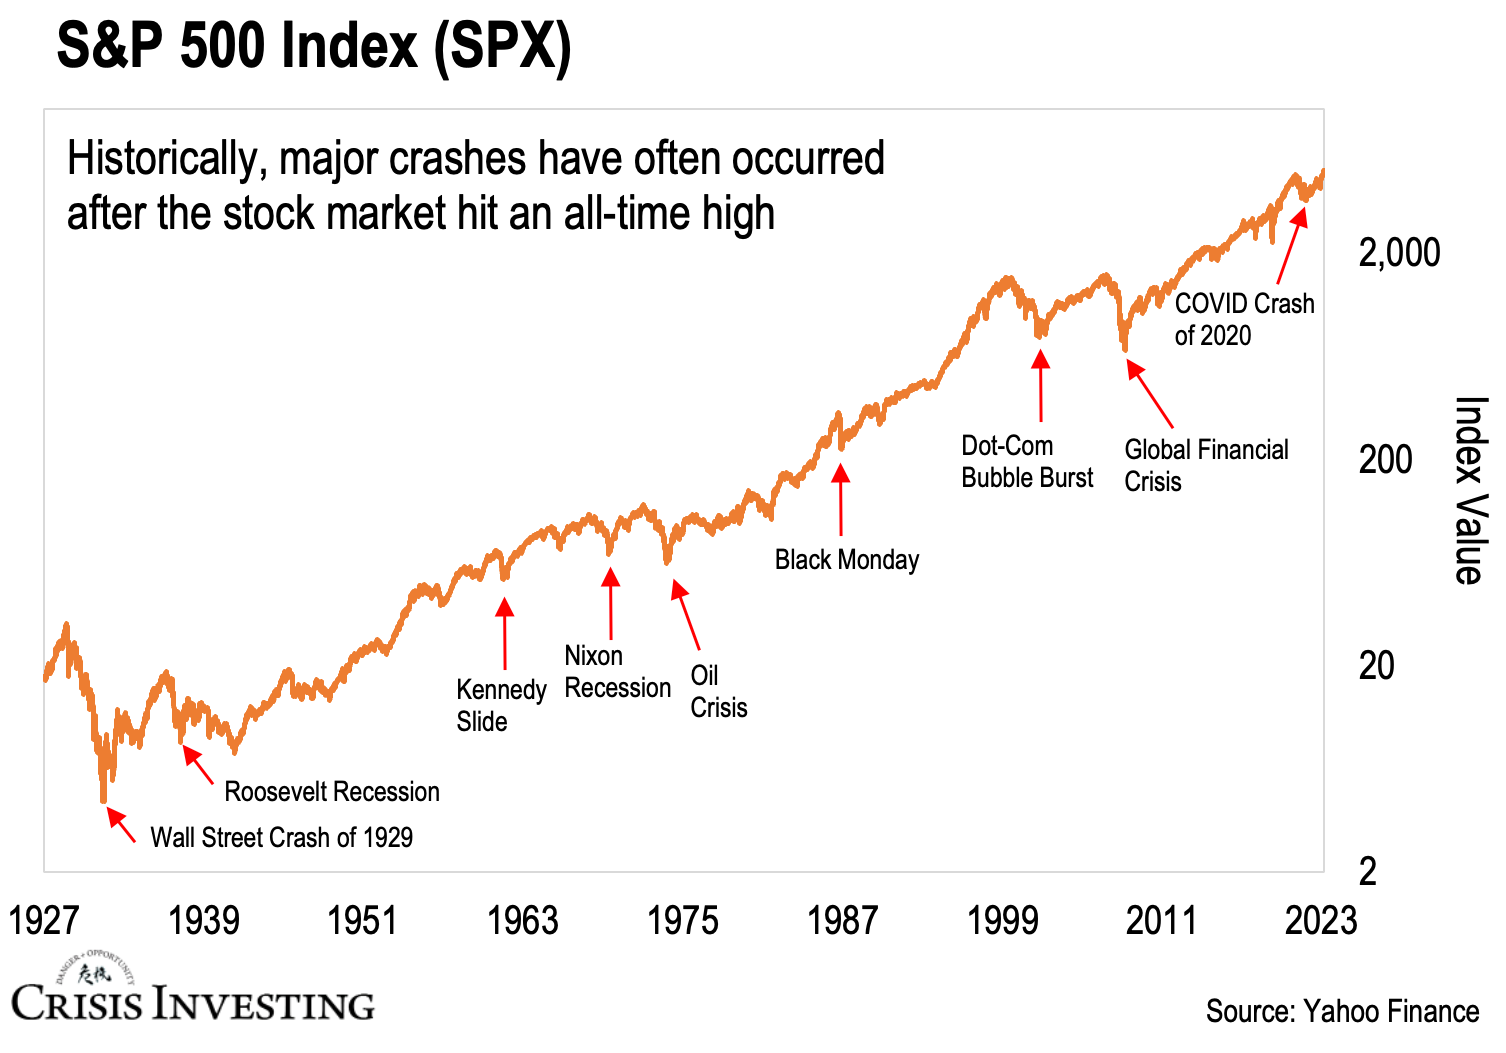
As you can see, if history is any guide, major stock market crashes tend to happen shortly after the market reaches an all-time high.
Now, once again, this usually doesn't happen right away. But if you look at the five most famous stock market crashes - the Wall Street Crash of 1929, 1987's Black Monday, the 2000 Dot-Com Bubble burst, the 2008-2009 Global Financial Crisis, and the COVID Crash of 2020 - all of these occurred while the stock market was at or near its all-time high. And there were many more, some of which I highlighted in the chart above (but not all).
And these weren’t just your run-of-the-mill 5-10% corrections. These were full-blown "oh my god, honey we won’t be able to continue our mortgage payments" crashes. Just take a look at the table below.

And, not to harp on it too much, but we've just hit a new all-time high.
For many, witnessing these record highs sparks a feeling of... well, you guessed it... missing out. This sentiment is even stronger when you hit a nice round number like 5,000.
The media hypes it up, influencers flood our feeds with bullish sentiment, and we begin to feel left out. So, to avoid feeling left out, we swiftly jump on the bandwagon…
But if you look at the next chart, this just doesn't quite seem like the right move right now.

The line above isn’t your regular price-to-earnings (P/E) ratio; instead, it’s the Shiller P/E ratio, an invention of Yale economics professor Robert Shiller (the same guy behind the Case-Shiller housing index).
Shiller’s P/E is the ratio of price to the average earnings of the last ten years adjusted for inflation. This calculation smooths out short-term earnings abnormalities and other distortions.
Here are a few observations that may pique your interest…
At the peak in 1929, the ratio stood at roughly 32. Today, it’s near 34.
Each time it surpassed that upper limit in the past (as indicated by the red line above) – including during the Dot-Com Bubble and the 2008-2009 Global Financial Crisis – it inevitably plummeted well below it.
Then there’s the historical average…
Since 1923, it has been about 18.5. Once again, the Shiller P/E ratio for the S&P 500 is currently about 34.
If the market were to return to its historical average, it would mean one of two things: either S&P 500 companies need to seriously boost their earnings, or we'd see the S&P 500 take a dive from where it's at now, just like it has in the past when we hit these all-time highs.
Have to say, the first option seems way less likely than the second.
Here’s Doug again:
In the past, the stock market was a straightforward bet on America: the economy would grow, companies would prosper, and stocks would rise. That was a very reasonable argument. But now the stock market is very detached from the economy. I might as well head to the casino, throw down on red, and cross my fingers for a jackpot. Ironically, you're probably better off at the casino anyway because at least you'll have a good time while you're there.
Bottom line: Yes, the S&P 500 can continue going up for a while longer – thanks to the FOMO factor I mentioned earlier – but since it’s already disconnected from fundamentals, investors will start selling in droves eventually… likely within this year.
That’s why the best course of action today may just be to do nothing.
But if you don’t feel like sitting this one out, you should at the very least avoid the most overbought stocks. When the stock market falls, people start to sell the stocks they bought into the most.
Remember, it's the herd mentality of the stock market that makes it work the way it does.
Until next time,
Lau Vegys
I appreciate the commentary. To me, that first chart (historical performance of the S&P) demonstrates one thing vividly: It makes no sense to try to time the market. Trying to determine how far up is the top, or how far down is the bottom, looks well nigh impossible, especially when you are in the thick of it. Perhaps there are others who can do it, and more power to them if they can (literally). I am not one of them.